

Indicator Gauge Icon Legend
Legend Colors
Red is bad, green is good, blue is not statistically different/neutral.
Compared to Distribution
 the value is in the best half of communities.
 the value is in the 2nd worst quarter of communities.
 the value is in the worst quarter of communities.
Compared to Target
 meets target;
  does not meet target.
Compared to a Single Value
 lower than the comparison value;
 higher than the comparison value;
 not statistically different from comparison value.
Trend

 non-significant change over time;
 significant change over time;
  no change over time.
Compared to Prior Value
 higher than the previous measurement period;
 lower than the previous measurement period;
 no statistically different change from previous measurement period.
 Significantly better than the overall value
 Significantly worse than the overall value
 No significant difference with the overall value
 No data on significance available
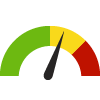
High School Students Who Have Used Non-medical Prescription Pain Medicine: Past 30 Days
State: Nevada
Measurement Period: 2023
This indicator is archived and is no longer being updated. Click to learn more
This indicator shows the percentage of high school students who have reported using prescription drugs (such as OxyContin, Percocet, Vicodin, codeine, Adderall, Ritalin, or Xanax) without a doctor's prescription or differently than how a doctor told them to use it during the 30 days before the survey
Why is this important?
Drug use as an adolescent is a major health concern, which can lead to a variety of health and mental health related issues in adulthood. Substance abuse also impairs judgment and can lead to other high-risk behaviors such as drunk driving and risky sexual activity.
6.0%
Source:
Nevada Youth Risk Behavior Survey
Measurement period: 2023
Maintained by: Truckee Meadows Tomorrow
Last update: September 2024
Measurement period: 2023
Maintained by: Truckee Meadows Tomorrow
Last update: September 2024
Compared to
Technical note: NOTE: The 2021 YRBS data was collected fall semester rather than spring semester, so the students were younger on average. Age can influence the risk behavior prevalence estimates. When comparing 2023 data to 2021 data, please refer to the UNR trend reports which weight the data by age for all years compared. The 2023 Nevada YRBS data were weighted based on the sex, race/ethnicity, and grade level of students in each region. The weighting process ensured that the estimates accurately represent the entire student population in each region and the state as a whole.
Graph Selections

Data Source
- Nevada Youth Risk Behavior Survey
Maintained By: Truckee Meadows Tomorrow
Filed under: Health / Medications & Prescriptions, Social Determinants of Health, Teens