

The 2024 Health Equity Index (formerly SocioNeeds Index), created by Conduent Healthy Communities Institute, is a measure of socioeconomic need that is correlated with poor health outcomes. The index is part of Conduent's SocioNeeds Index® Suite, which provides analytics around social determinants of health to advance equitable outcomes for a range of topics.
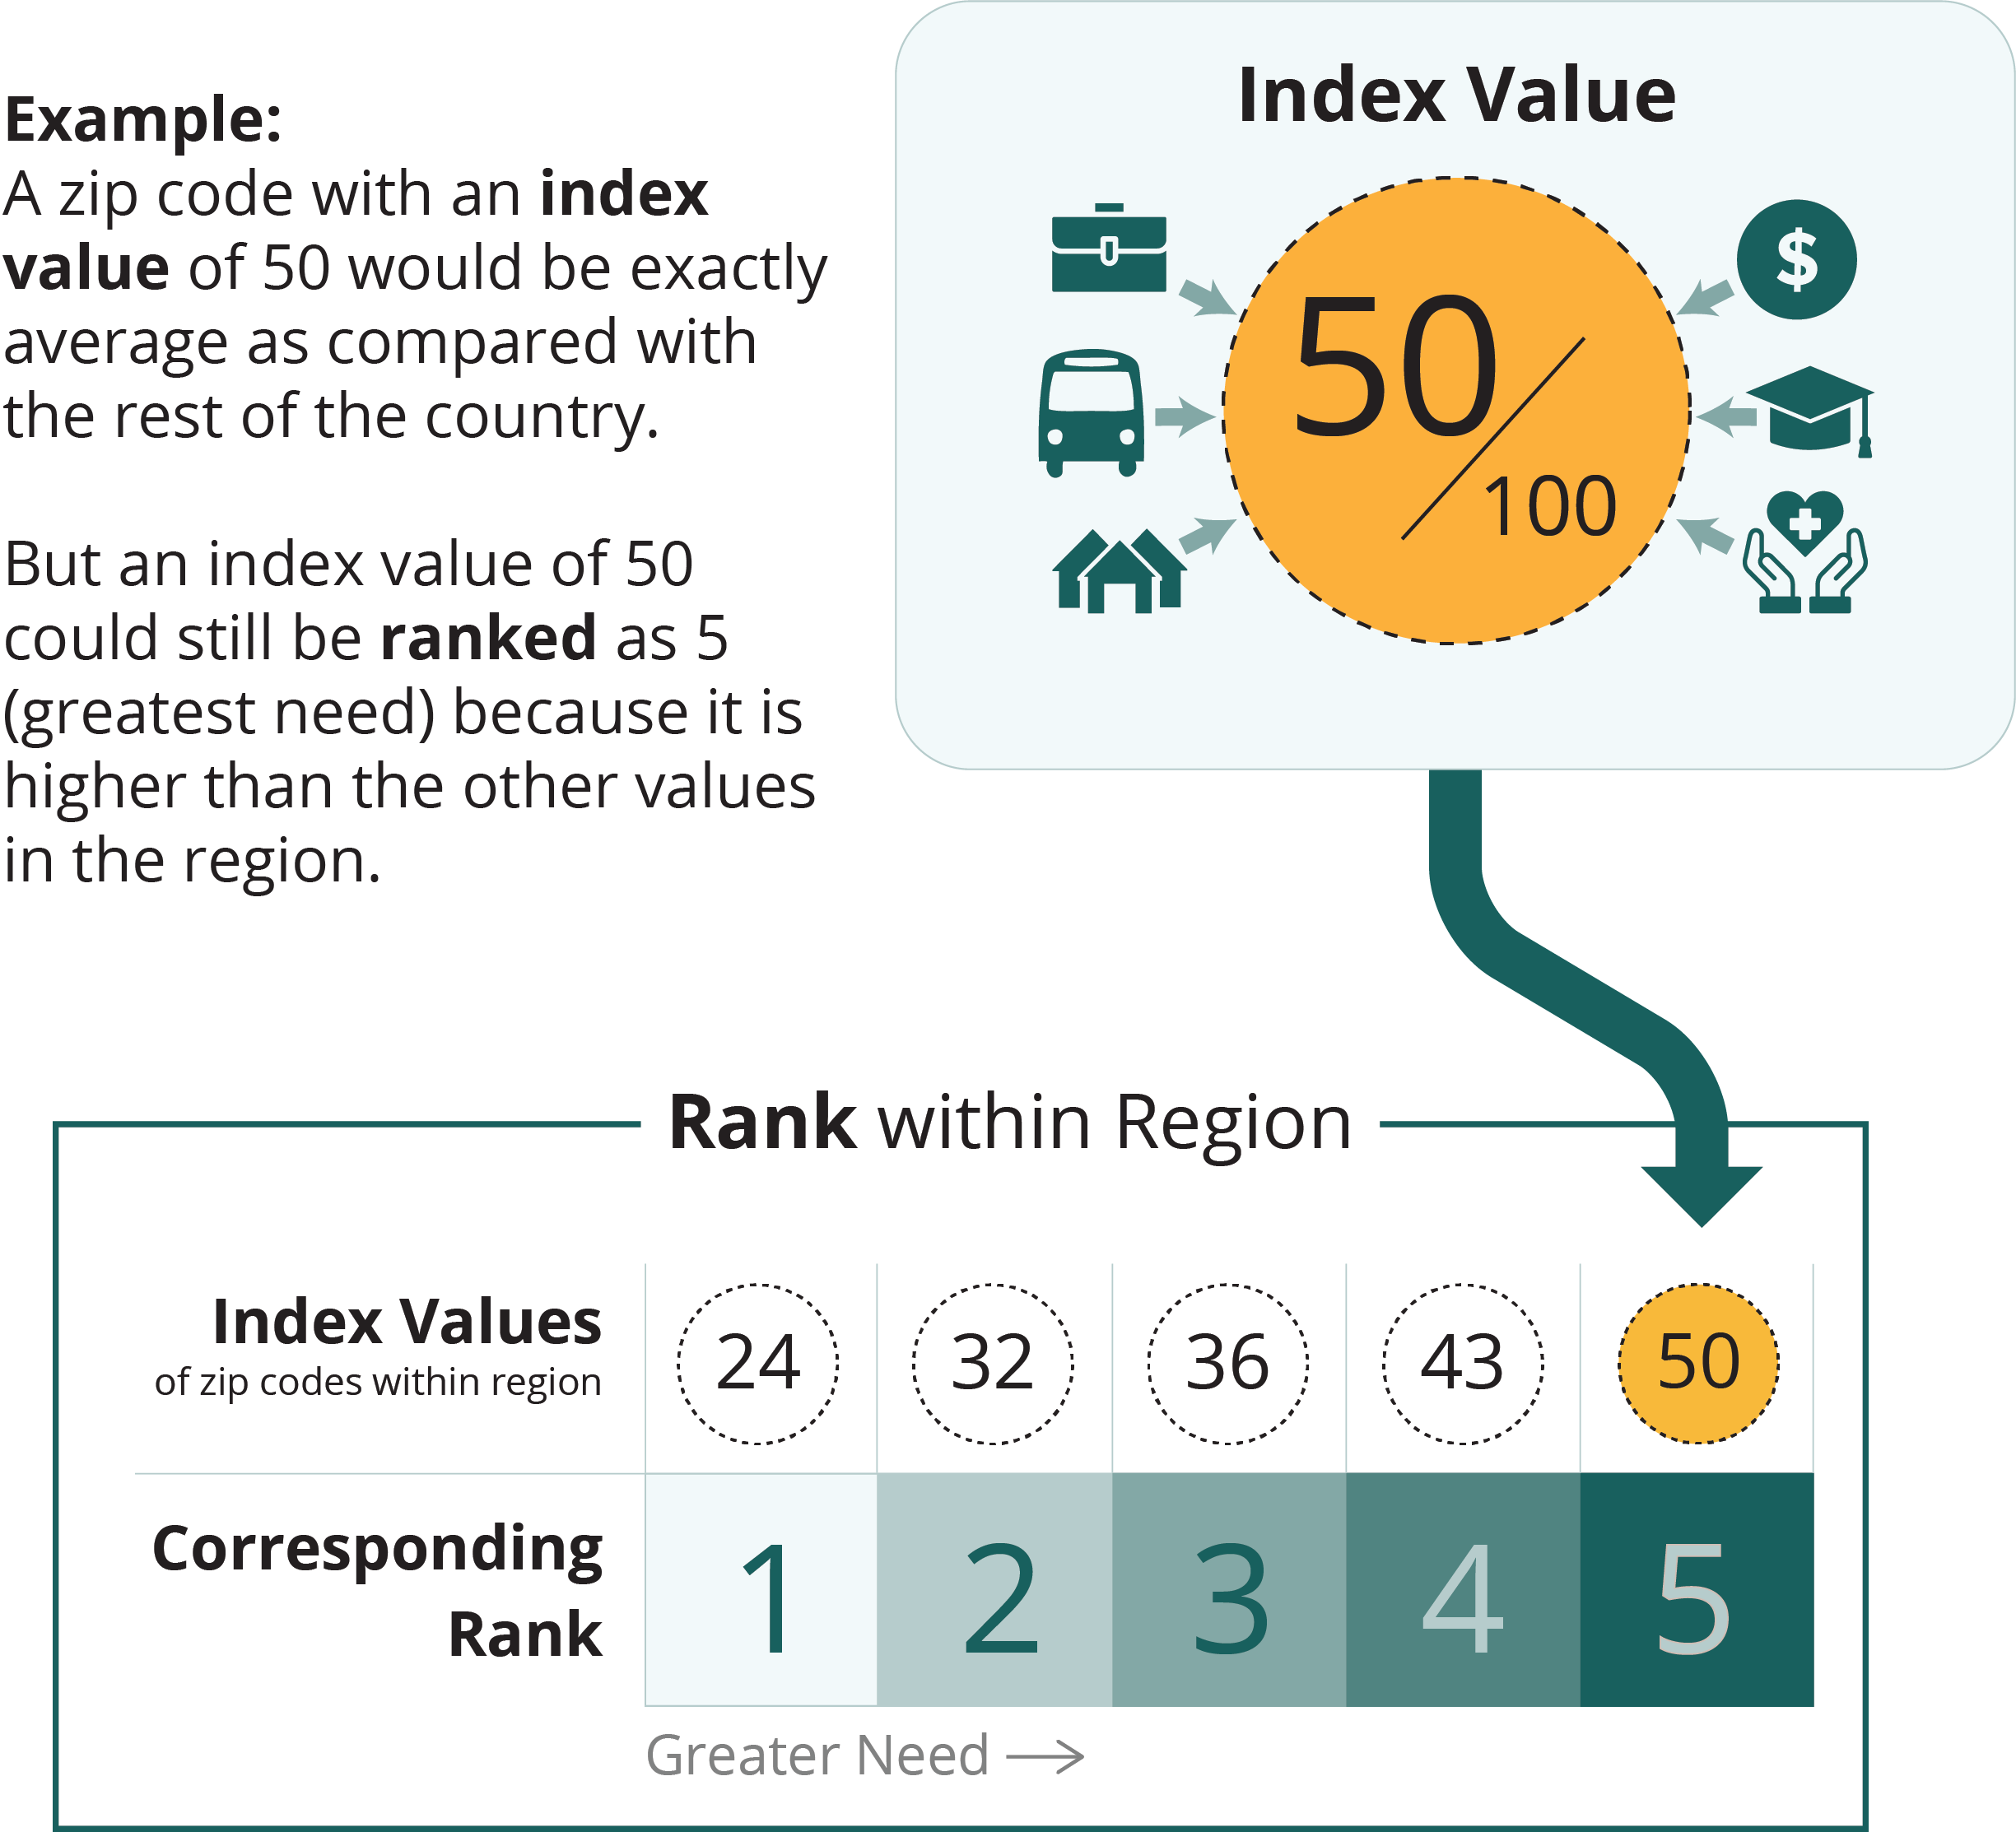
All zip codes, counties, and county equivalents in the United States are given an index value from 0 (low need) to 100 (high need). To help you find the areas of highest need in your community, the selected locations are ranked from 1 (low need) to 5 (high need) based on their index value relative to similar locations within the region.

map legend
greater need
1
2
3
4
5


| Zip Codesort column | Indexsort column | Ranksort column | Pop.sort column | Countysort column |
|---|---|---|---|---|
| 89433 | 91.3 | 5 | 22,493 | Washoe |
| 89442 | 85.2 | 5 | 1,012 | Washoe |
| 89424 | 84.1 | 5 | 448 | Washoe |
| 89431 | 81.3 | 5 | 41,170 | Washoe |
| 89502 | 67.6 | 4 | 46,575 | Washoe |
| 89512 | 67.2 | 4 | 31,470 | Washoe |
| 89510 | 58.9 | 4 | 2,577 | Washoe |
| 89501 | 58.4 | 4 | 4,509 | Washoe |
| 89503 | 49.8 | 3 | 28,771 | Washoe |
| 89506 | 45.2 | 3 | 45,740 | Washoe |
| 89704 | 40.6 | 3 | 4,446 | Washoe |
| 89508 | 38.4 | 3 | 13,949 | Washoe |
| 89434 | 36.4 | 3 | 28,727 | Washoe |
| 89439 | 31.1 | 3 | 2,399 | Washoe |
| 89436 | 26.8 | 2 | 49,427 | Washoe |
| 89509 | 20.6 | 2 | 35,936 | Washoe |
| 89521 | 16.2 | 2 | 44,130 | Washoe |
| 89523 | 14.0 | 2 | 37,927 | Washoe |
| 89441 | 6.2 | 1 | 14,410 | Washoe |
| 89451 | 6.2 | 1 | 9,687 | Washoe |
| 89511 | 4.0 | 1 | 30,916 | Washoe |
| 89519 | 2.9 | 1 | 9,777 | Washoe |
| 89402 | 2.5 | 1 | 333 | Washoe |
Data Source
The Health Equity Index is calculated by Conduent Healthy Communities Institute using data from Claritas Pop-Facts®, 2024 and Claritas Consumer Profiles, 2023.
Technical Note
Index values are not comparable across measurement periods. Index values and rankings are specific to a measurement period, showing the relative ranking of a location in comparison to other similar locations at that time.