


RANKED HEALTH PRIORITIES
This section describes the methodology for determining the ranked health needs in Washoe County. Ranking the health needs provides a means for understanding and organizing the large amount of secondary data (extracted statistics/numbers from available county, state and national databases) and primary data (firsthand collected community data through online community survey, focus groups, and key informant interviews) contained within the assessment. Although the health topics rank differently when looking at only primary or only secondary data independent of one another, the overall rank, which includes both, identifies which areas of need community members may be more inclined to support and ultimately where efforts will have the best capacity to influence.
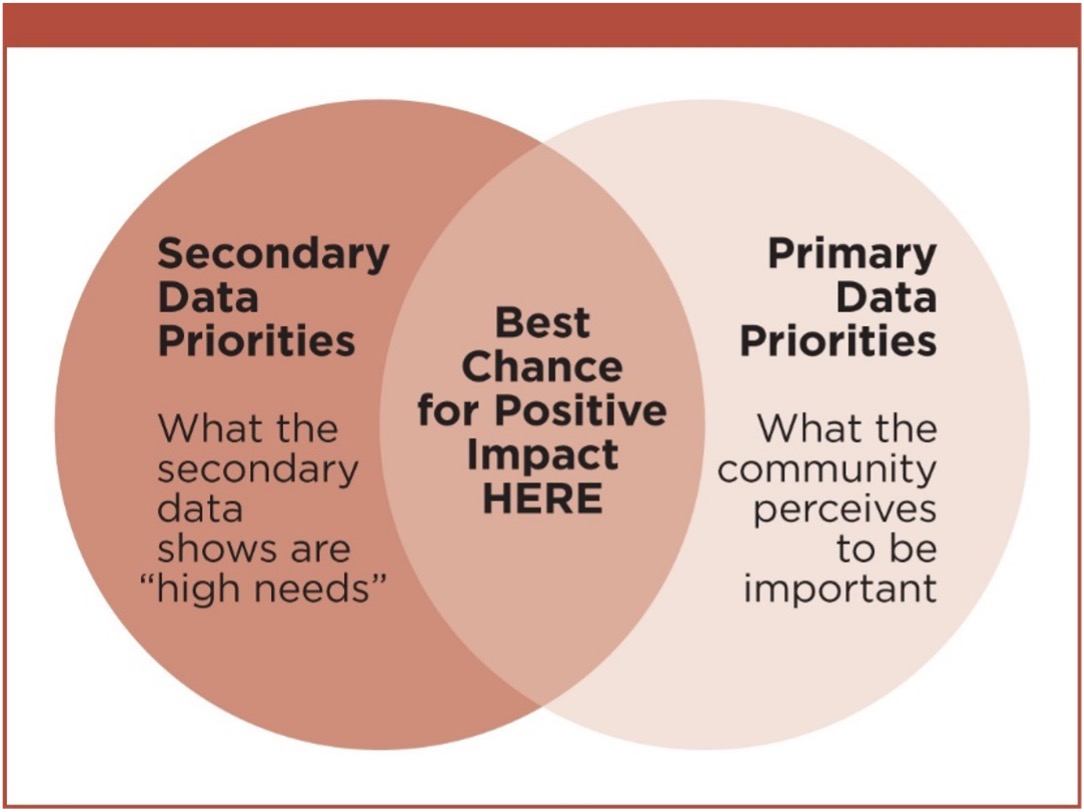 It is important to consider both the secondary data indicators and the primary data input (community’s perception of important health topics) for prioritization. Future programs and initiatives based on only the secondary data rankings may not be endorsed by the community and could result in an ineffective expenditure of resources. Alternatively, development of initiatives to improve community health based solely on the primary data would be biased towards the perceptions and input of only persons and organizations able to participate in primary data collection methods, instead of incorporating the information reliable and accurate data provided through the secondary data sources, which are generalizable and representative of the county population.
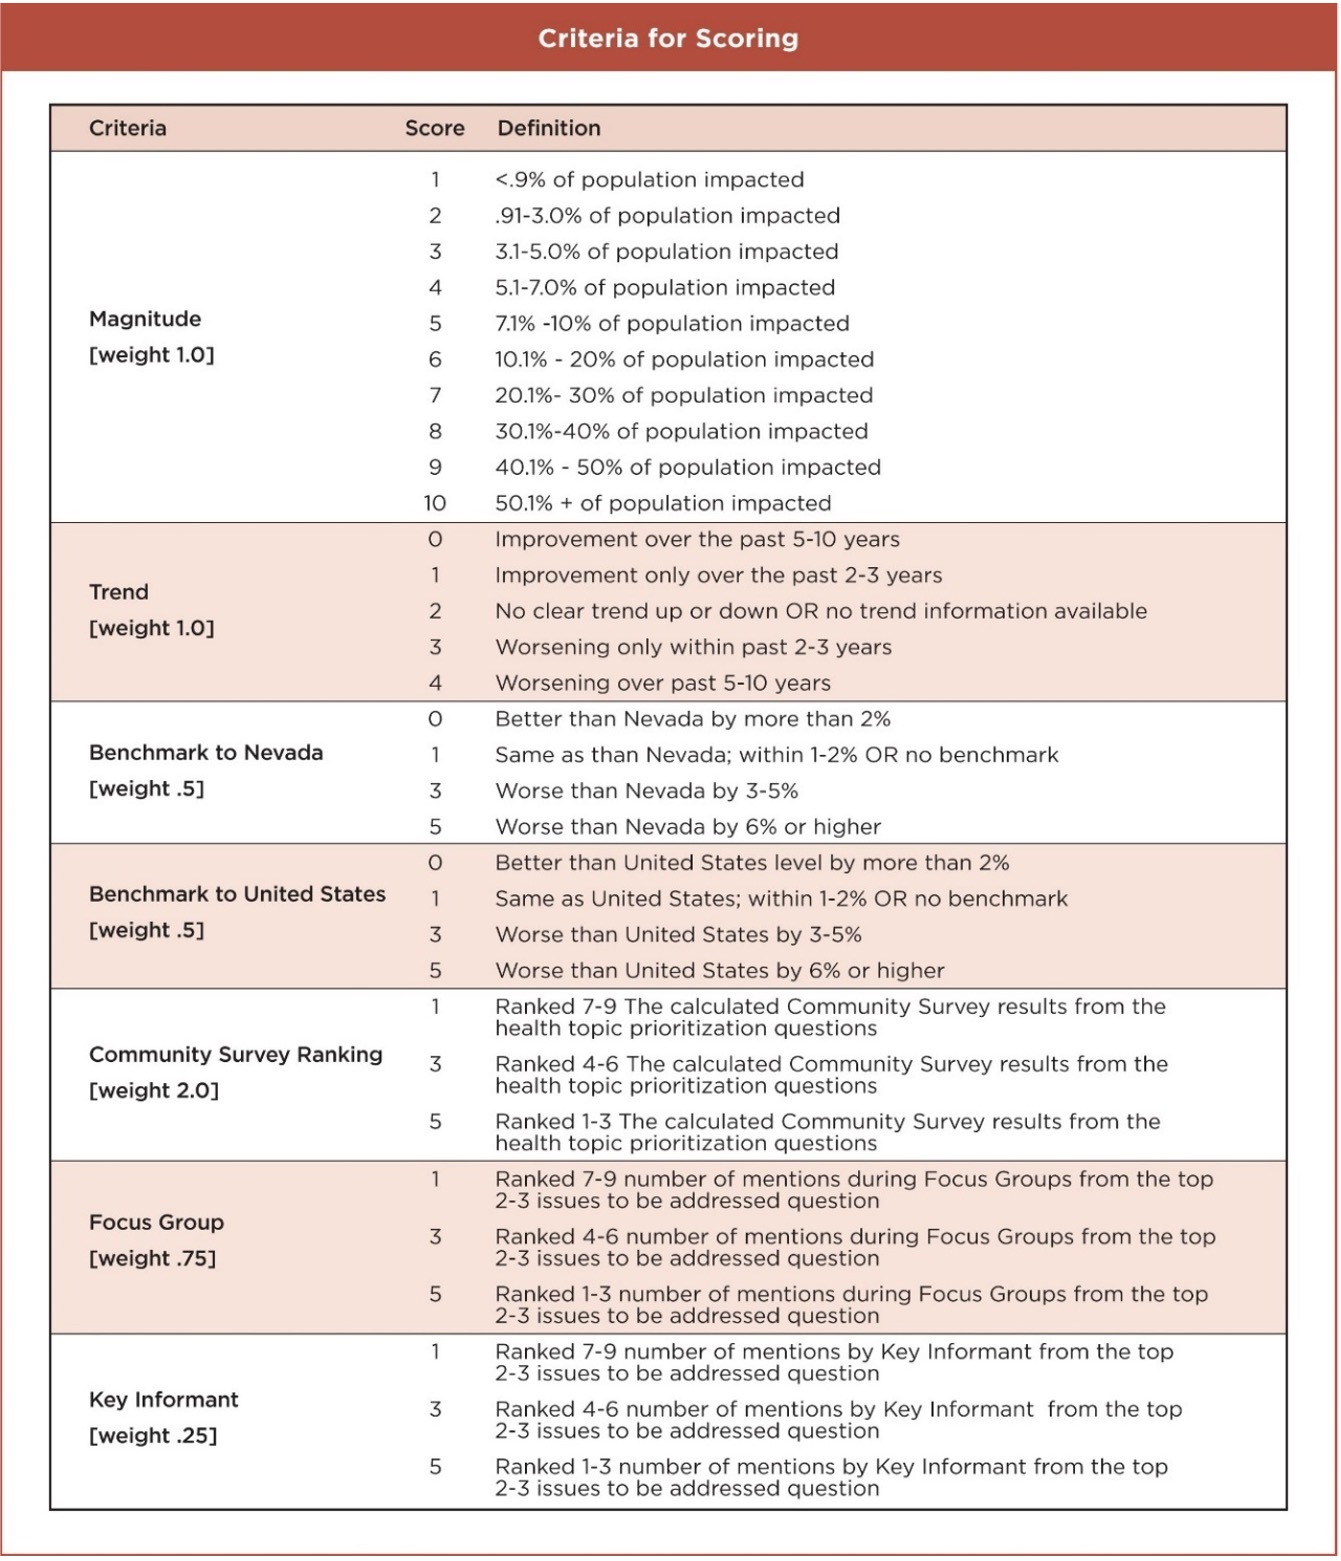
The Hanlon Method was selected as the objective approach to score and rank the health topics. Seven criteria, 1) Magnitude; 2) Trend, 3) Benchmark compared to Nevada; 4) Benchmark compared to the United States; 5) Community survey ranking; 6) Focus group identified needs; and 7) Key informant identified needs, were utilized to apply a scoring matrix to rank the health topics. The overall score and rank evaluate the secondary and primary data across eight major health topics, and assigned scores to each section per the criteria, resulting in the rankings as described in this section.
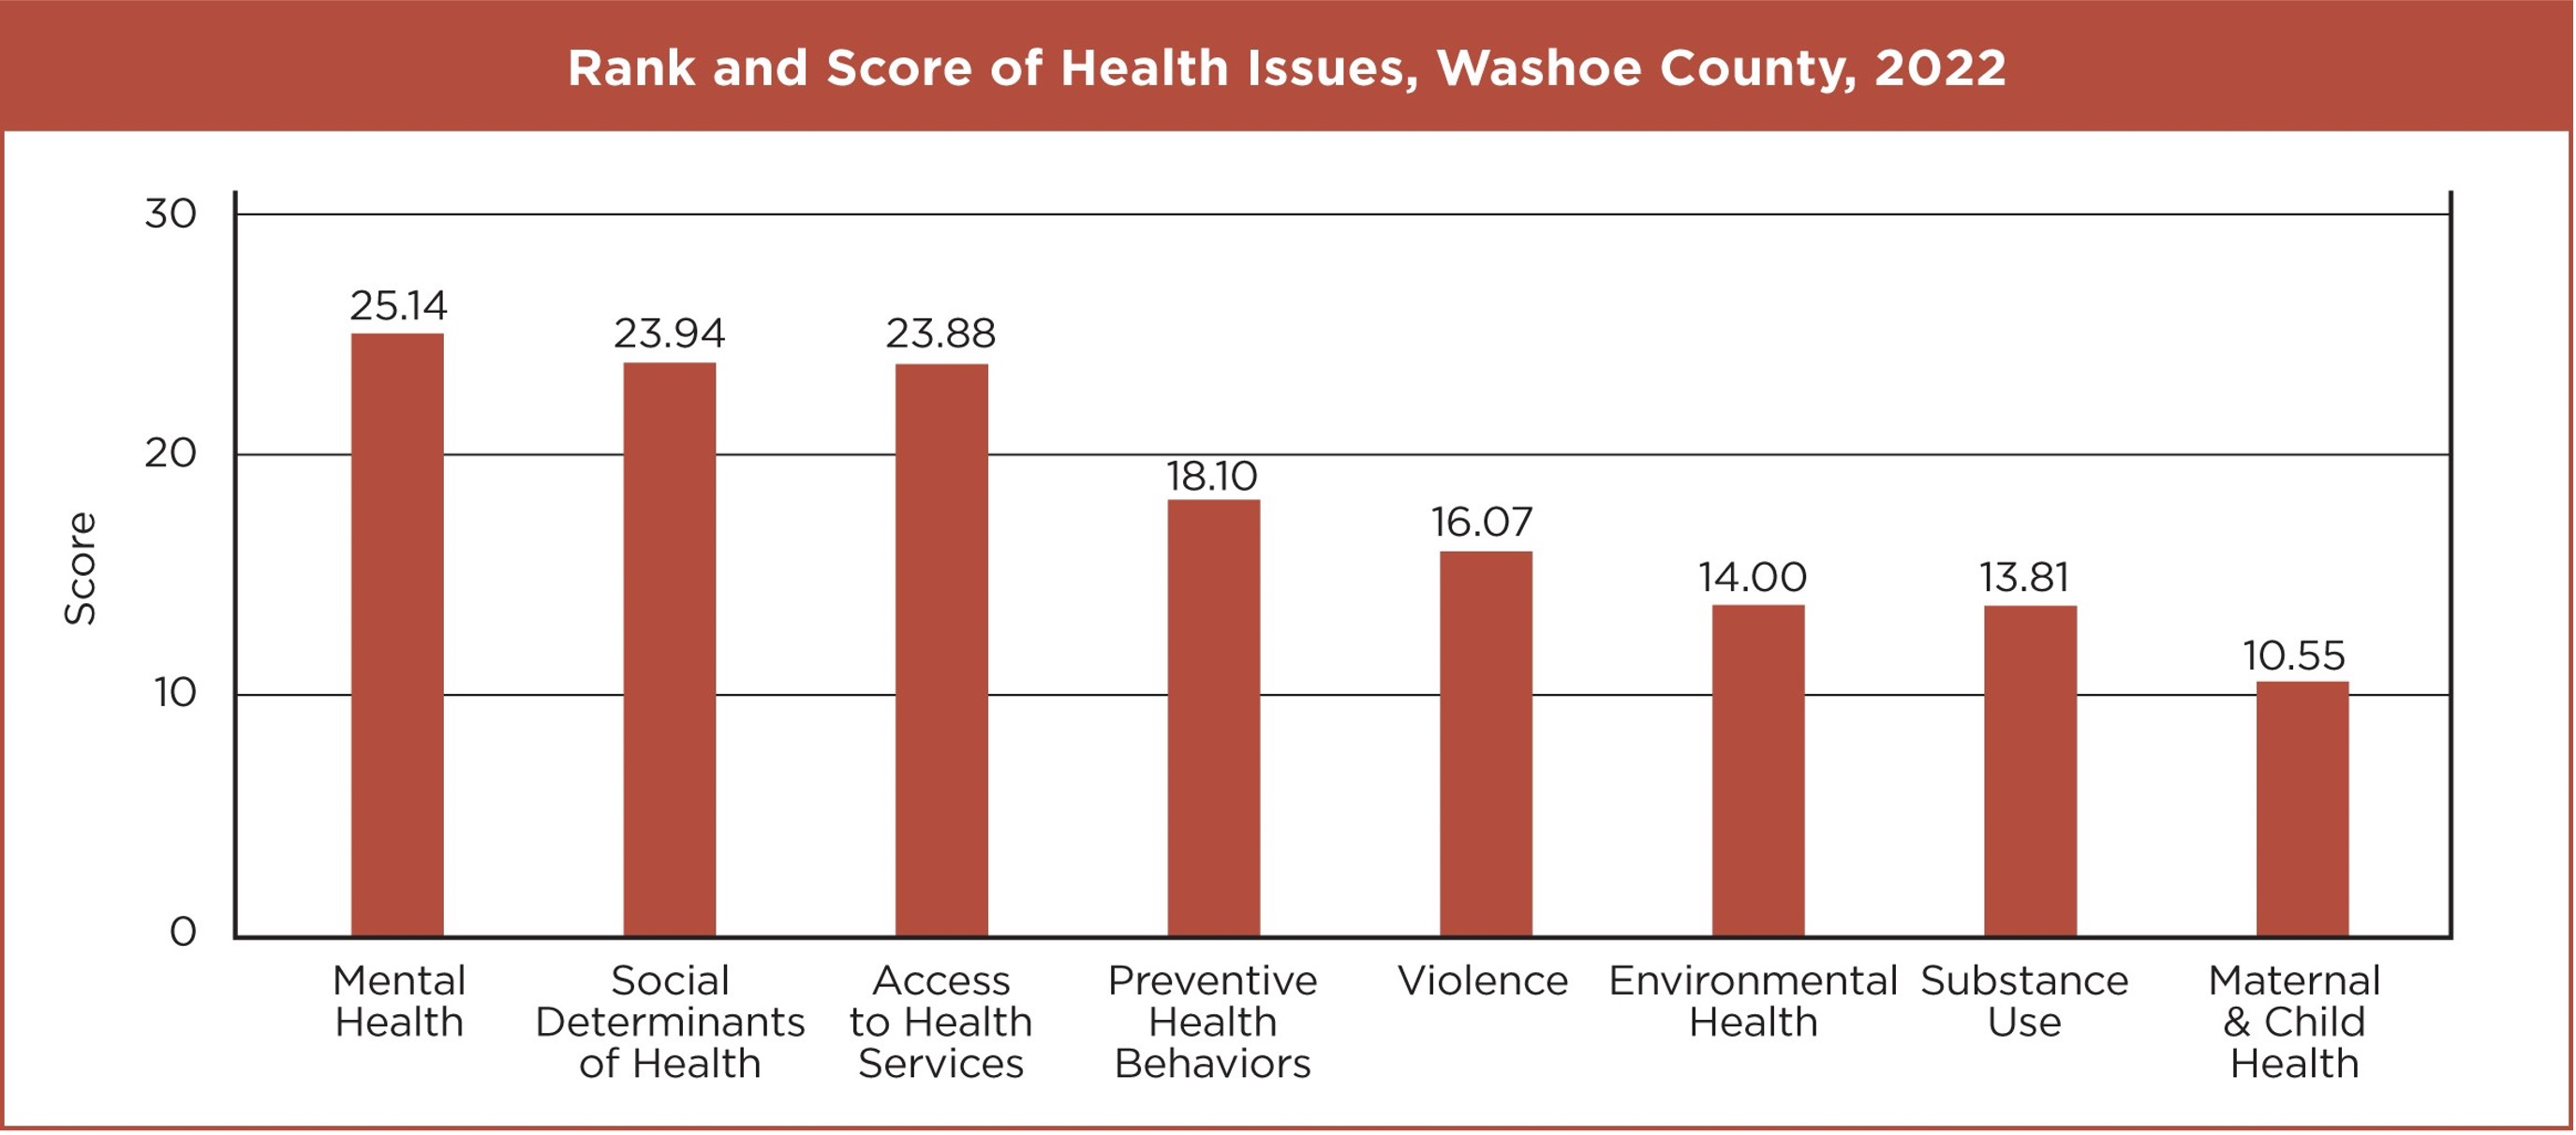
The final rank, score, and examples of types of issues included for the eight health topics were:
Mental Health, score 25.14: depression, stress, and suicide
Social Determinants of Health, score 23.94: educational performance, educational attainment, income, housing costs, poverty rates, homelessness
Access to Health Services, score 23.88: rates of uninsured, needing a provider and not being able to see one, provider shortages
Preventive Health Behaviors, score 18.10: nutrition, physical activity, sleep, preventive screenings, immunizations, weight status, oral health
Violence, score 16.07: crime rates, bullying, sexual and physical dating violence, physical assault, gun-related injuries and deaths, child abuse and neglect
Environmental Health, score 14.00: air and water quality, food safety, illegal dumping
Substance Use, score 13.81: alcohol consumption, cigarette use, marijuana use, driving under the influence of alcohol, prescription drug use and abuse
Maternal and Child Health, score 10.55: sex education, single-parent household, low birth weight, preterm births, prenatal care, pregnancy prevention, teen birth rates, sexually transmitted infections.
While reviewing ranks and scores, one should consider the many factors that influence health behaviors and health outcomes including dynamic and complex factors not captured or in some instances not measurable within a single health topic.
 Mental health (#1), for example, often coincides with substance use (#7). Substance use serves as a coping mechanism among many people with mental illness, which can in turn exacerbate mental health issues and both factors may be influenced by having access to health services (#3). Any approach to address health needs should be aware of and recognize the relationships between human nature, behavioral changes, and the systemic factors that influence health outcomes.
METHODOLOGY FOR SCORING AND RANKING HEALTH TOPICS
Scores were calculated for each of the secondary data indicators using the following criteria: magnitude, trend, benchmark to Nevada, and benchmark to United States. Scores were generated for primary data sources (community ranking, focus group mentions and key informant mentions) separately, and were applied to the major health topic. The total score incorporating both the secondary and primary scores is the final score for a particular health topic used in overall ranking. Criteria were weighted differently, based on various factors which were discussed with the Steering Committee for input and feedback prior to applying criteria and scoring. The weighted approach is needed because strength and limitations pertaining to quality and reliability of data are considered so that the overall score can be as unbiased as possible.
CRITERIA FOR SCORING
Magnitude: The percent, rate, or number of the population impacted.
Trend: Improvement, no improvement, or worsening over time.
Benchmark to Nevada: Washoe County percentage or rate relative to Nevada
Benchmark to United States: Washoe County percentage or rate relative to United States
Community Survey Ranking: Perceived importance as determined by the score resulting from the online community survey respondents.
Focus Group: Top issues identified by focus group participants.
Key Informant: Top issues identified by key informants.
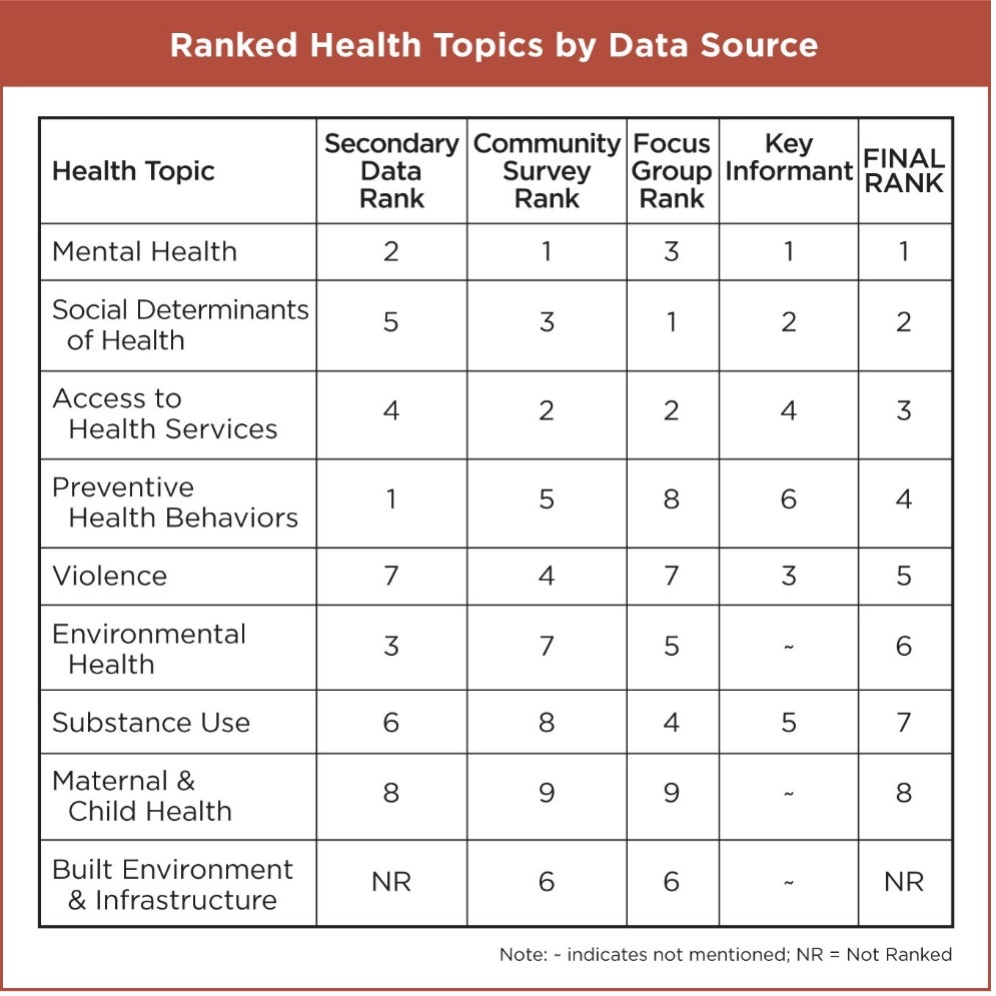 Comparing rankings across the different sources of primary and secondary data is helpful to visualize various types of data input relative to the overall final rank order.
If only secondary data were evaluated, preventive health behaviors would be the top ranked issue, which is in line with research demonstrating that improving preventive behaviors such as eating healthy, engaging in physical activity, reducing screen time, adequate amount of sleep, receiving recommending screenings and immunizations are far less costly to society and result in longer and better-quality lives at a population level.
The diverse range of ranking of health issues across the primary data collection methods are often driven by current events which are garnering attention at the time of data collection. For example, in past health assessments, air quality ranked highest due to gathering input during the summer when air quality was poor due to wildfire smoke, an issue which was most important to several participants as breathing was difficult and outdoor recreation was unsafe due to dangerous levels of air pollution.
Of note, the built environment and infrastructure was not included in the overall ranking due to the format of available data as there was no data available to evaluate trends over time and a lack of proven method available to compare to the state and nation overall, thus three of the four criteria were missing for built environment and infrastructure. Three of the nine topics were not selected as top health priorities by key informants including environmental health, maternal and child health, and built environment and infrastructure, therefore those topics were given a score of one, the lowest rank for the key informant criteria.
LIMITATIONS
While ranking the health needs provides an objective way to measure needs, the scores could differ based on any number of changes, however the overall rank is not likely to drastically shift. These changes include, but are not limited to, the grouping of health topics, the online community survey development and administration, and the individual indicators (secondary data) that were included in the assessment. The ranking helps to summarize the health topics in an organized manner by simplifying the large amount of data included in the assessment.It is important to recognize the limitations of the methods employed to score and rank this data and most importantly to acknowledge that health behaviors and outcomes are influenced by a dynamic, complex range of factors.